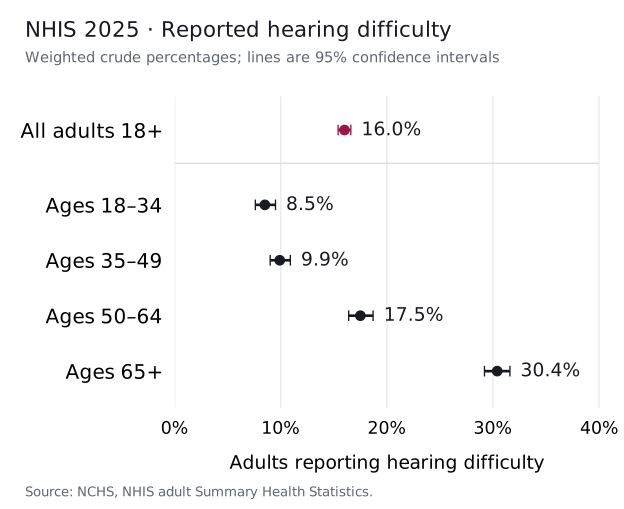
The National Center for Health Statistics estimates that 16.0% of U.S. civilian noninstitutionalized adults aged 18 and older reported hearing difficulty in 2025. The published 95% confidence interval is 15.4% to 16.6%. This Dispatch analysis examines the annual survey measure and its limits; it is not a new CDC announcement.
The National Health Interview Survey indicator, Any difficulty hearing, includes people reporting some difficulty, a lot of difficulty or an inability to hear. People who use hearing aids answer about difficulty even with their aids. The measure therefore includes a broad range of reported difficulty, rather than only the most severe response categories.
The published estimates
| Population | Estimate | 95% CI |
|---|---|---|
| All adults 18+ | 16.0% | 15.4–16.6% |
| Ages 18–34 | 8.5% | 7.6–9.5% |
| Ages 35–49 | 9.9% | 9.0–10.9% |
| Ages 50–64 | 17.5% | 16.4–18.7% |
| Ages 65+ | 30.4% | 29.2–31.6% |
- Population
- U.S. civilian noninstitutionalized adults aged 18 and older; 50 states and District of Columbia.
- Definition
- Reported some difficulty, a lot of difficulty or inability to hear, even with hearing aids for those who use them.
- Method
- Official weighted NHIS crude percentages and published 95% confidence intervals. Unknown responses are excluded. No estimates or intervals recalculated.
- Limits
- Reported difficulty is not an audiometric diagnosis or a measure of care demand. No group significance test, ranking or time trend is claimed. No flag was returned for these five rows.
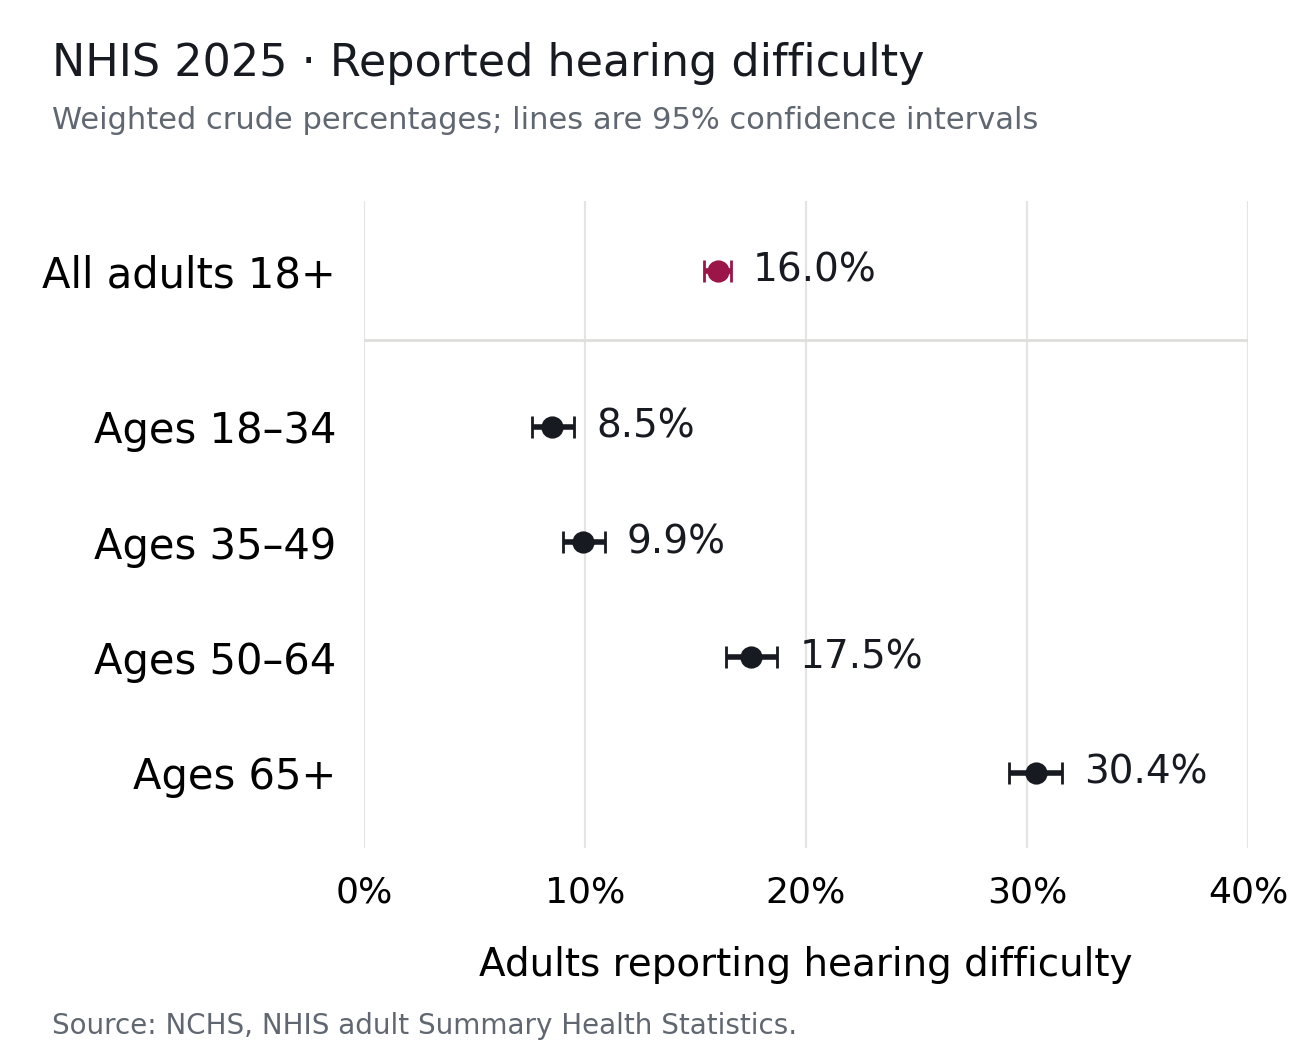
The table reproduces the five official estimates for all adults and four broad age groups. These are crude percentages, without age adjustment. Each interval is the one published by NCHS; the Dispatch has not recalculated uncertainty from rounded percentages. The all-adult figure covers the combined population and is not an equally weighted average of the four age-group estimates.
NHIS represents the civilian noninstitutionalized population in the 50 states and District of Columbia. Its sample is weighted to that population. For these health estimates, unknown responses, including refusals and answers not ascertained, are excluded from both numerator and denominator. The numbers describe 2025, not the current year's prevalence.
Reported difficulty is not an audiometric test result, a diagnosed condition or a count of people seeking ENT care. These rows do not establish treatment need, appointment demand, unmet need or the effectiveness of a hearing device. Nor does this analysis test differences between age groups or infer a year-to-year trend. NCHS documents a sample-design change in 2025 as well as the survey's 2019 redesign.
For readers evaluating a hearing statistic in a presentation or announcement, the useful companion to the headline number is the measure's definition: who was represented, which response categories counted, which year was observed and how much sampling uncertainty NCHS reported. The table keeps those boundaries visible so the estimate can be cited for the question it actually answers.
National hearing data can give ENT professionals useful population context. This measure describes reported difficulty in a defined survey population; converting it into a practice's addressable market or an estimate of treatment demand would require separate evidence.
Go to the source.
NCHS: NHIS adult estimates, five 2025 hearing rows ↗NCHS: hearing definition and referenced footnotes ↗NCHS: 2019–2025 adult Summary Health Statistics technical notes ↗NCHS: 2025 NHIS documentation, updated August 27, 2026 ↗CDC data catalog: source update metadata ↗This analysis describes historical public survey estimates. It does not diagnose a condition, estimate treatment demand or recommend a treatment.